
Calc Guide
Chapter
8
Using the DataPilot
This document is Copyright © 2009–2011 by its contributors as listed below. You may distribute it and/or modify it under the terms of the Creative Commons Attribution-Share Alike License (http://creativecommons.org/licenses/by-sa/3.0/), version 3.0 or later.
All trademarks within this guide belong to their legitimate owners.
Authors
Barbara Duprey
Hal Parker
Feedback
Please direct any comments or suggestions about this document to: documentation@libreoffice.org
Acknowledgments
This chapter is based on Chapter 8 of the OpenOffice.org 3.3 Calc Guide, which was adapted from a German original written by Stefan Weigel and translated into English by Sigrid Kronenberger. Other contributors to that chapter are:
Jean
Hollis Weber Andy Brown Sharon Whiston
Claire Wood Martin Fox
Publication date and software version
Published 23 January 2011. Based on LibreOffice 3.3.
Some keystrokes and menu items are different on a Mac from those used in Windows and Linux. The table below gives some common substitutions for the instructions in this chapter. For a more detailed list, see the application Help.
|
Windows/Linux |
Mac equivalent |
Effect |
|
Tools → Options menu selection |
LibreOffice → Preferences |
Access setup options |
|
Right-click |
Control+click |
Open context menu |
|
Ctrl (Control) |
z (Command) |
Used with other keys |
|
F5 |
Shift+z+F5 |
Open the Navigator |
|
F11 |
z+T |
Open Styles & Formatting window |
Contents
Examples with step by step descriptions 5
Example 1: Sales volume overview 5
Practical problems and questions 6
Practical problems and questions 13
Example 3: Frequency distribution 17
Solution with a matrix formula 20
Solution with the DataPilot 20
DataPilot functions in detail 24
The database (preconditions) 24
More settings for the fields – Field Options 29
Working with the results of the DataPilot 34
Change layout by using drag and drop 34
Grouping of categories with scalar values 34
Grouping of categories with date or time values 35
Grouping without the automatic creation of intervals 36
Many requests for software support are the result of using complicated formulas and solutions to solve simple day to day problems. More efficient and effective solutions use the DataPilot, a tool for combining, comparing, and analyzing large amounts of data easily. Using the DataPilot, you can view different summaries of the source data, display the details of areas of interest, and create reports, whether you are a beginner, an intermediate or advanced user.
This chapter is divided into two sections:
“Examples with step by step descriptions” uses three typical cases to demonstrate the advantages and applications of the DataPilot. Follow the examples to learn how easy it is to use the DataPilot.
“DataPilot functions in detail” starting on page 24 describes the DataPilot in detail. You can use this part to look up how a function is used.
Examples with step by step descriptions
This section demonstrates some of the possibilities of the DataPilot in typical use cases. By following the step by step description, you can recreate the examples and learn about the power of the DataPilot.
Example 1: Sales volume overview
A typical introductory example in courses and books for beginners with spreadsheets is a simple sales volume overview.
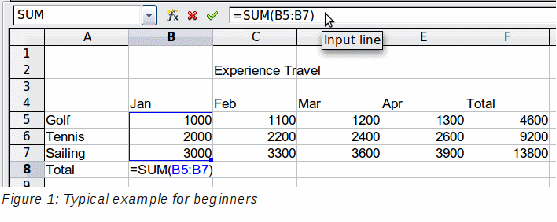
This example demonstrates the user interface and how to insert text and numbers into cells. Useful aids like AutoFill and drag and drop have been demonstrated in other chapters. The most important part is the connection between cells through formulas, for example addition with the plus operator or the SUM function.
This small exercise might be useful for a first contact with the program, but it shows only a very small fraction of the tasks in an office. To create such a sales overview, you also need the original base data. That is, before you can use a spreadsheet to create a sales overview, you need to add the (possibly many) single purchases from different lists and then enter the sums into the relevant cells C5 to F7.
Practical problems and questions
To display additional values for May, June, July, and so on, you need to add extra columns; that is, you have to change the structure of the calculation sheet. This is not only somewhat inefficient from a workflow point of view, but it also raises some practical questions: How do references react if you add more columns or rows to the sum formulas?
The layout, where the timeline is displayed horizontally, is less convenient if you want to add more months. A vertical layout might be a more efficient use of space. How can the table be transposed? Do you have to enter everything again?
What if management asks unexpected questions or adds an additional subdivision for the different sales regions or a constraint of the sales for a given employee? In these cases you again have to manually add all the sums and create different tables in many variations.
Is it really acceptable and realistic to create such an overview by adding the different values manually? This is really a lot of work and extremely error-prone!
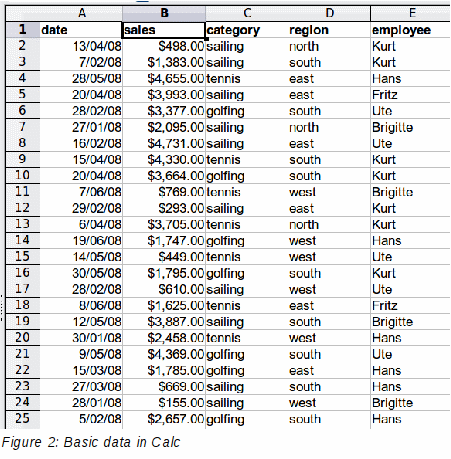
The most important part of your task in the example is the addition of the Total sales per month cells, which had to be done manually. To do this automatically with the program, just get the data into Calc. You can enter the single numbers by hand or you can import a file from your bookkeeping software. In any case we assume a continuous table that keeps track of all sales in a somewhat primitive form.
You can create the sales volume overview by following these instructions:
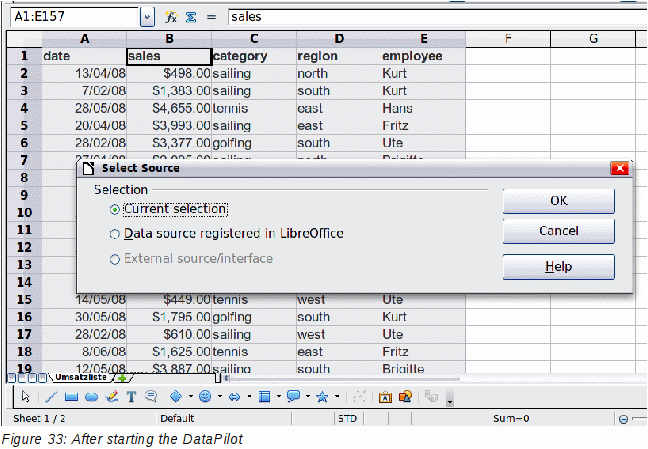
Select the cell A1 (or any other single cell within the list).
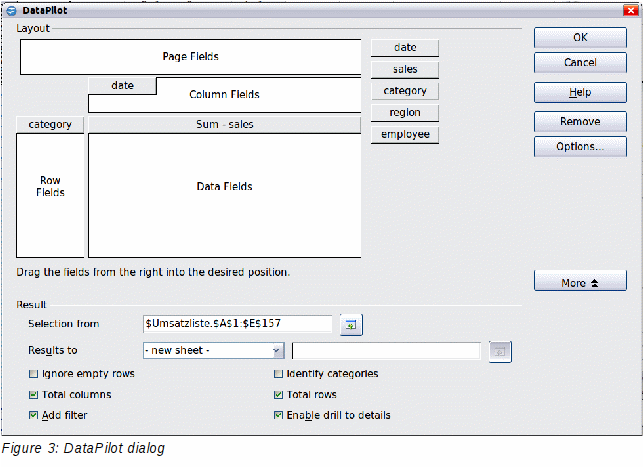
Select Data → DataPilot → Start. On the Select Source dialog, choose Current selection and click OK.
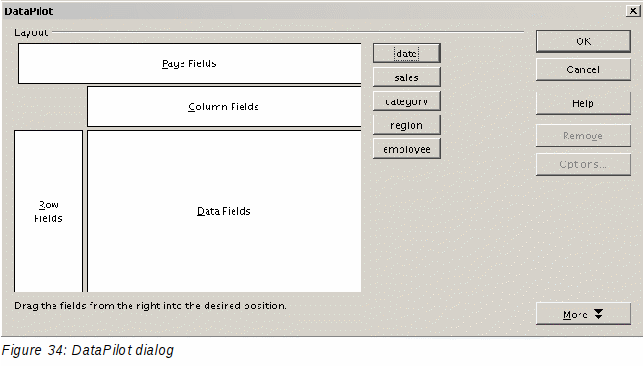
The DataPilot dialog (Figure 3) has four white layout areas and several fields that look like buttons. These small fields are the titles of the different columns of your list.
Move (drag and drop with the mouse) the date field into the Column Fields area.
Move the sales field into the Data Fields area.
Move the category field into the Row Fields area.
Click More, to see more options in the lower part of the dialog.
In the Results to drop-down list, select – new sheet –.
Click OK.
The result appears on a new sheet. It has the desired structure, but the columns are not yet grouped into months.
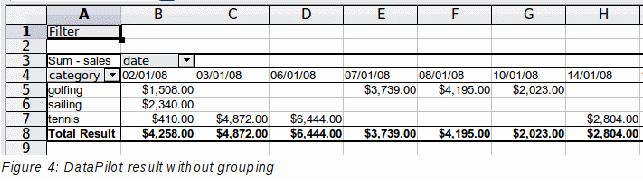
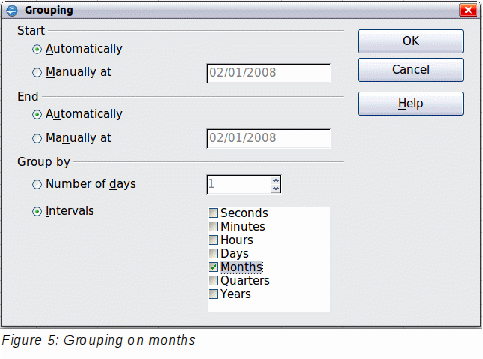
To group the columns, select cell B4 or any other cell that contains a date. Then select Data → Group and Outline → Group. On the Grouping dialog (Figure 5), make sure Intervals and Months are selected in the Group by section, and click OK. The result is now grouped for months (Figure 6).
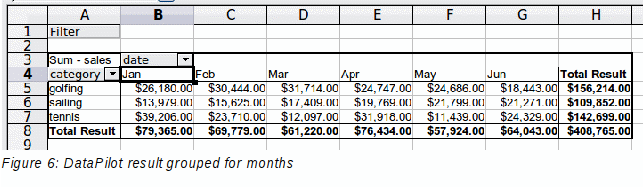
In this result you will recognize the beginners’ example. It is very easy to produce, without any further knowledge about the spreadsheet. You do not have to enter any formulas.
No manual entering or adding of any values is necessary. There is less work and fewer errors.
The layout is very flexible: months horizontal and categories vertical or vice versa, in two mouse clicks.
Additional differentiating factors are immediately available.
Many types of evaluation are possible; for example, number or average instead of sum, accumulated values, comparisons, and so on.
We will now demonstrate some of these advantages.
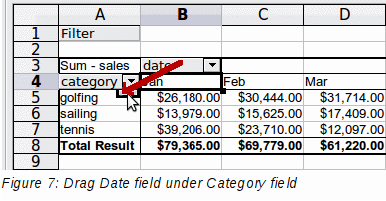
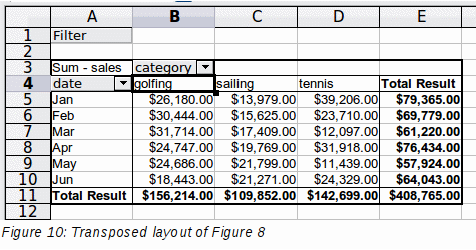
Starting with the result of Figure 6, use the mouse to drag the Date field under the Category field, as shown in Figure 7.
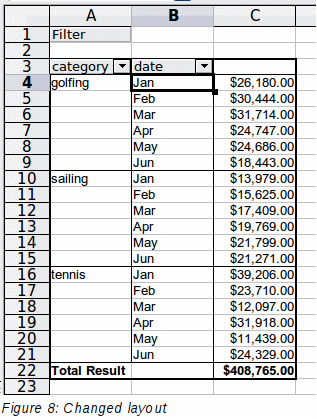
Now the summary is as shown in Figure 8.
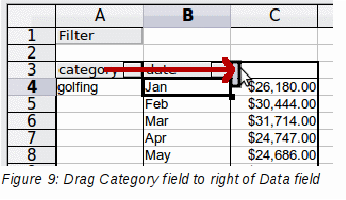
To transpose the table completely, just drag the Category field above the area of the displayed values, to cell C3 (see Figure 9). The result of this action is shown in Figure 10.
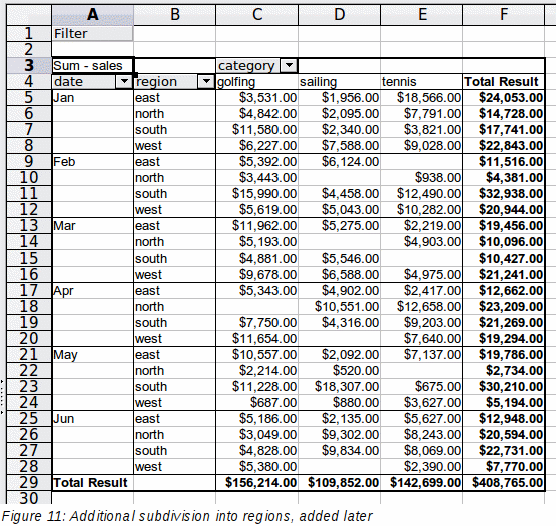
In contrast to the beginners’ example in Figure 1, it is now very simple to view or add different aspects of the underlying data. For example, to see the values for different regions, do the following:
Select the cell A3 (or any other single cell that is part of the DataPilot result).
Select Data → DataPilot → Start to start the DataPilot again.
Drag the Region field into the Row Fields area. Depending on the order you choose for the row fields, the result is either regions with date subdivisions or vice versa.
Click OK. The result is shown in Figure 11.
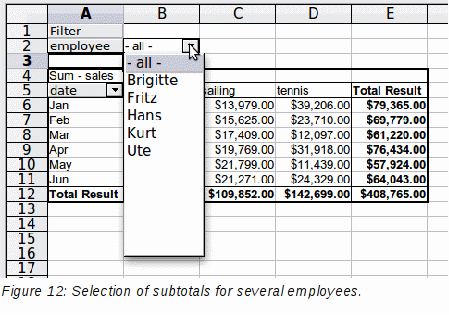
In another variation you may want to add the employees.
Select the cell A3 (or any other single cell that is part of the DataPilot result).
Select Data → DataPilot → Start, to start the DataPilot again.
You do not need the Region field in this case. Drag it out of the layout area.
Drag the Employee field into the Page Fields area.
Click OK. The result is shown in Figure 12.
Fields that you use as page fields are placed in the result above the summary with the name Filter. You then have a drop-down list that you can use to show only the sums of a given employee.
Up to now we have not seen the most powerful features of the DataPilot. The following examples will show you more.
This example is often used by consultants and in several variations in user support. The task is to provide a means for one or more users to keep track of working hours.
|
Note |
In the real world timekeeping requires tracking working time on individual projects. Specialized database software is often used but for simple applications in a small company a Calc spreadsheet and the Data Pilot might be all that is needed to track work done. |
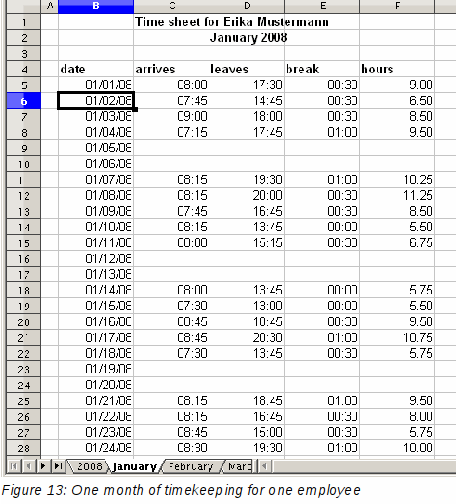
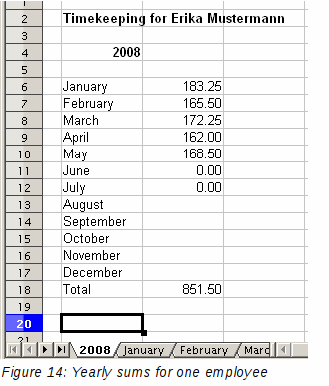
A typical way of doing this is to create a spreadsheet per month and a sum sheet with all the results of one year. For each employee, there is one file (see Figures 13 and 14 for examples of two pages from the file for one employee).
Practical problems and questions
It is very difficult and time-consuming to create the timekeeping table: 12 sheets that have to be copied from a raw template and adjusted for each month, and a sheet with all the yearly sums with references to all the other sheets. Users often search for a macro to make the creation easier.
The file shown contains only the data of one employee. How can you get all the data for all the employees, so that you can have a summary of all the work hours from all employees of a department or the whole company?
How can you compare employees and/or departments?
The file shown contains data for one year. How can you compare it with the data of the previous years?
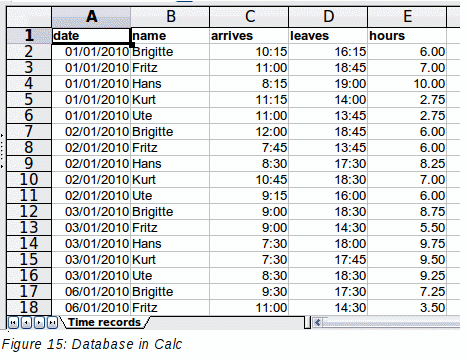
To use the DataPilot for this task, collect all the data into one single table. This can be done either manually or by importing a file from an (electronic) timekeeping machine.
In very simple cases, each employee takes care of their own working hours. If you need calculations that cover several employees, departments, or the whole company, just copy everything into one huge table (Figure 15).
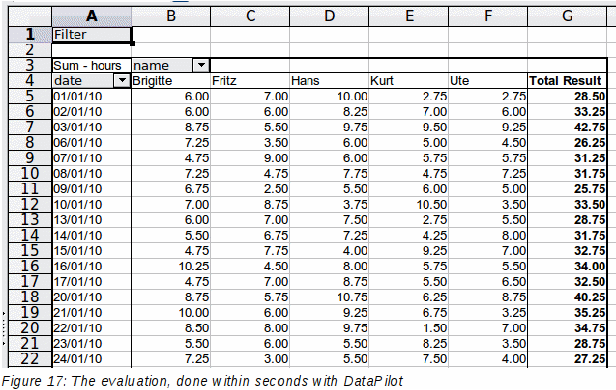
Using the DataPilot requires only 12 mouse clicks and gives you a nice overview within seconds:
Select the cell A1 (or any other single cell within the list).
Choose Data → DataPilot → Start and click OK.
On the DataPilot dialog (Figure 16):
Drag date into the Row Fields area.
Drag hours into the Data Fields area. Notice that it becomes Sum – hours.
Drag name into the Column Fields area.
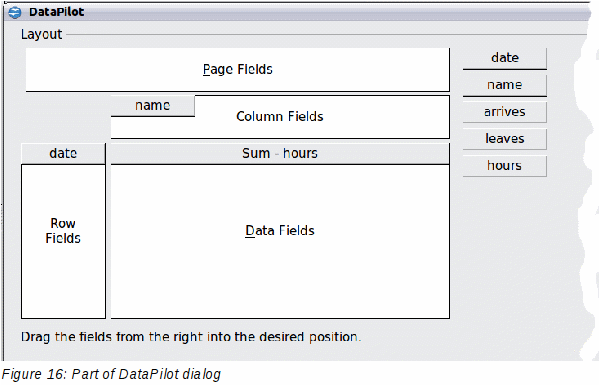
Click More to show more options in the lower part of the dialog.
Choose – new sheet – for Results to.
Click OK.
The result appears on a new sheet (Figure 17).
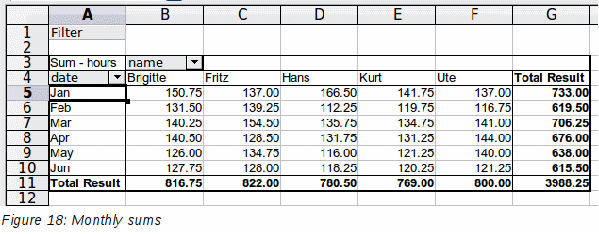
The result is much more powerful than is possible with the classic formula-based calculation. For example, you can summarize the daily results to a monthly result very easily:
To group together the rows, select the cell A5 (or any other cell that contains a date).
Choose Data → Group and Outline → Group . On the Grouping dialog, leave Start and End as Automatically; in the Group by section, choose Intervals and Months. Click OK. The result is now grouped into months.
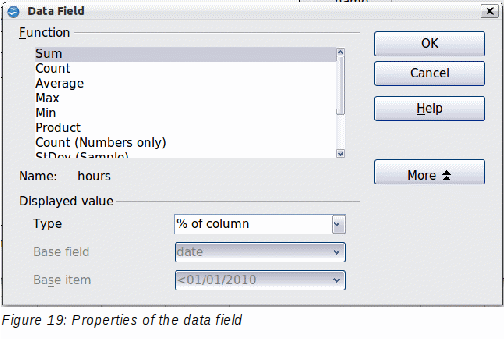
If you need a result with a percentage, start the DataPilot from this page.
Select the cell A3 (or any other single cell that contains a result of the DataPilot).
Choose Data → DataPilot → Start.
Double-click on Sum – hours to open the Data Field dialog (Figure 19).
Click on More, to see more options.
Switch Displayed value → Type to % of column.
Click OK to return to the DataPilot dialog, then click OK again.
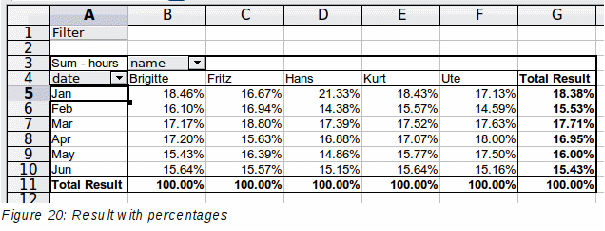
The result shows percentages as a decimal number. If you prefer to have a percent format, select the cells and click on the % icon in the menu bar (Figure 20).
To get a comparison between employees, start the DataPilot again from the output sheet:
Select the cell A3 (or any other cell that contains a result of the DataPilot).
Choose Data → DataPilot → Start.
Double-click on Sum – hours to open the Data Field dialog.
Click More, to see more options.
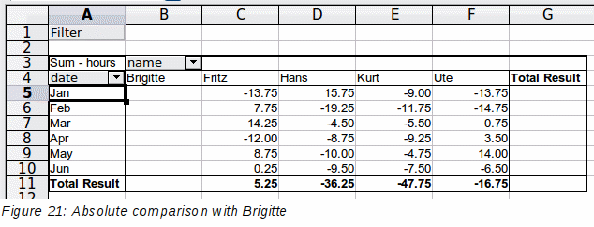
Switch the Type of the displayed value to Difference from.
Switch the Base field to name.
Switch the Base item to Brigitte.
Click OK to return to the DataPilot dialog, then click OK again.
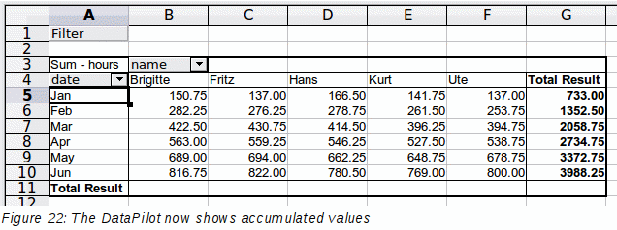
As a final example we switch to an accumulated view; that is, continuing sums of all values:
Select the cell A3 (or any other cell that contains a result of the DataPilot).
Choose Data → DataPilot → Start.
Double-click on Sum – hours to open the Data Field dialog.
Click More, to see more options.
Switch the type of the displayed value to Running total in.
Switch the Base field to Date.
Click OK to return to the DataPilot dialog, then click OK again.
These examples show an important aspect of the DataPilot. Normally you have to collect your data according to the way you want the result to be represented. This means you have to use a specific structure and you are stuck with it.
The DataPilot works more like a real database. The source data are collected in a simple spreadsheet that contains all data. Only when you want to look at it do you select which part of the data you want to use.
Example 3: Frequency distribution
For showing the frequency of incidents, Calc uses the function FREQUENCY. This formula has to be used in a so-called matrix formula. This is an advanced feature. Alternatively you can use the DataPilot, which requires almost no knowledge of spreadsheets.
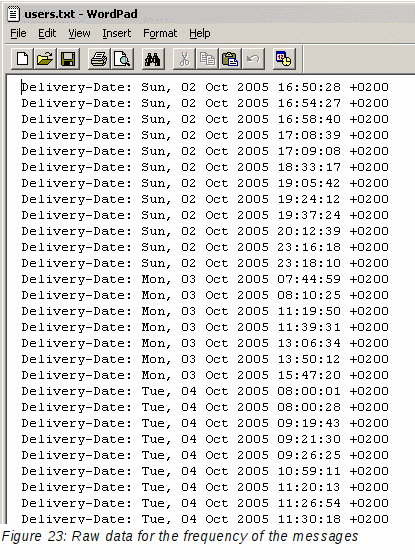
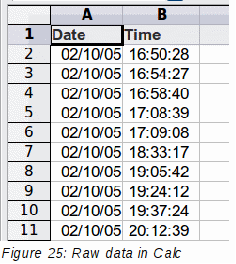
In our example we want to investigate the number of emails that go to the Germanophone support mailing list. We want to know how the activity on the list is distributed during the day.
The starting point for this example is the mailbox file of the Thunderbird mail client. The command (in Linux)
grep 'Delivery-Date:' Inbox > users.txt
creates a text file that contains, for the timespan of more than 2 years, one line for each message, with date and time. (See Figure 23.)
To import the data into a table in Calc, choose Insert → Sheet From File and select the text file users.txt containing the raw data. The Text Import dialog (Figure 24) appears. Here you can choose your import options. Use the following properties:
Separator options: Fixed width
Divide into columns at position 20, 31 and 40
Column types:
Column
1: Hide
Column 2: Date
(DMY)
Column 3: Standard
Column 4: Hide
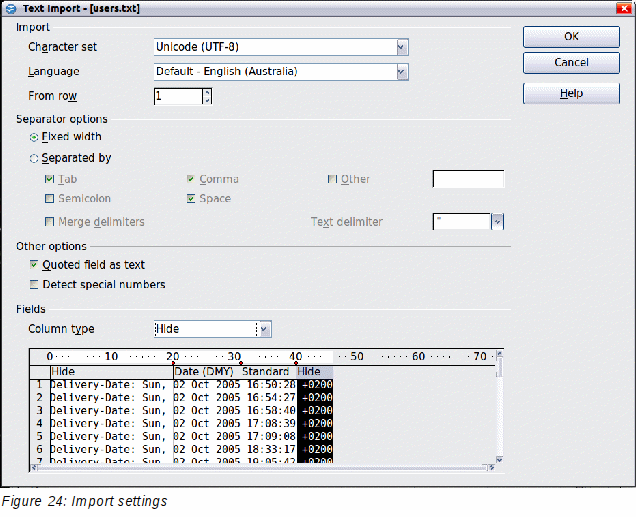
Figure 25 shows the imported raw data with a row added at the top containing titles for each column.
Solution with a matrix formula
To calculate the frequency you have to create 24 classes, one for each hour. In the next column you enter the number of emails with the function FREQUENCY.
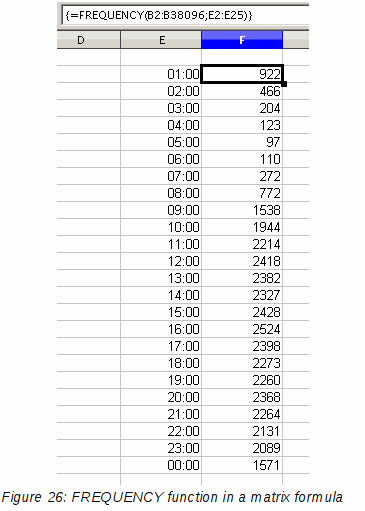
The first argument is the cell area with the times of all approximately 38,000 emails. The second argument is the cell area E2:E25 that describes the frequency classes. To enter the formula, first select the cell area F2:F25, then enter the formula. Then finish the formula by using the key combination Shift+Ctrl+Enter. This indicates to the program that you want to use a matrix formula. To indicate the matrix formula, the program uses curly brackets.
This technique is most often known only to (and used by) advanced users.
With the DataPilot you can achieve the same result much easier and faster. The solution is also possible for less advanced users. Starting with the raw data (Figure 25), you need only a few mouse clicks.
Select the cell A1 (or any other cell within the list).
Choose Data → DataPilot → Start and click OK.
In the DataPilot:
Drag Time into the Row Fields area.
Drag Date into the Data Fields area.
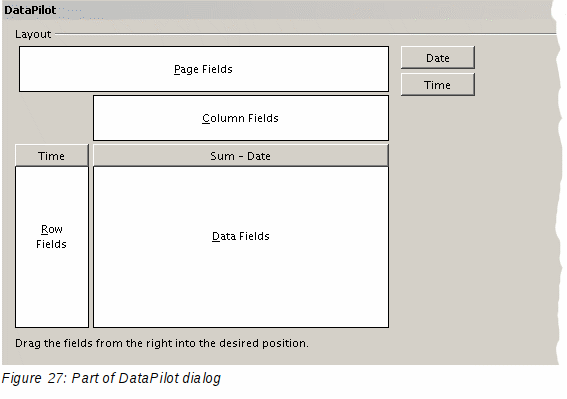
Click More to show more options in the lower part of the dialog.
Choose – new sheet – for Results to.
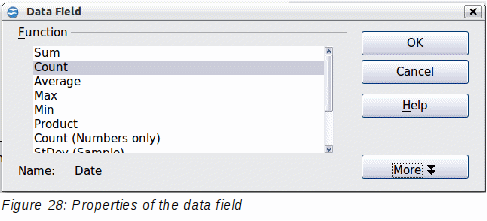
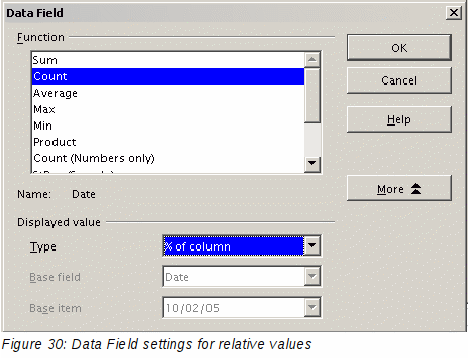
In this case we need to count the number of values, not their sum. Double-click on Sum – Date to open the Data Field dialog and select the function Count (see Figure 28).
Click OK. As an intermediate result, you get a DataPilot table that has for every time within the raw data a separate line.
|
Note |
This may be a very time-consuming process because of the large number of items. The time does not depend that much on the number of lines but rather on the number of rows needed for the table that contains the results. |
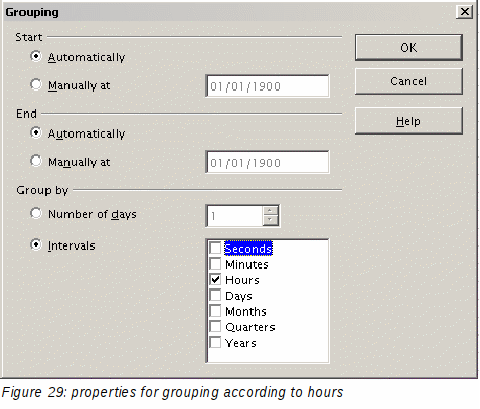
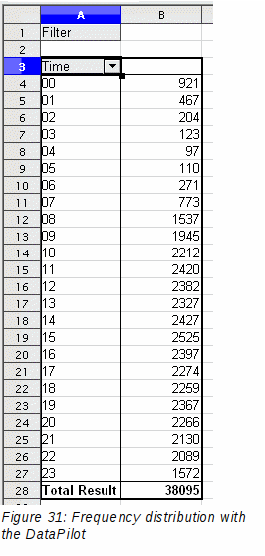
For grouping the rows, select the cell A4 or any other cell that contains a time.
Choose Data → Group and Outline → Group, select for the interval Hours and click OK. The result is now grouped according to hours as shown in Figure 31.
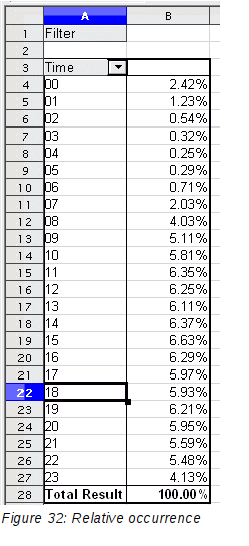
Restart the DataPilot and double-click on the Sum-Date data field. Figure 30 shows the Data Field dialog for the data field Number – Date. Click More and select as type % of column. The result is shown in Figure 32. Figure 31 shows the absolute occurrence.
Whether the relative values are shown as a decimal (0.1) or as a percentage (10%) depends only on the cell formatting itself and has nothing to do with the DataPilot.
This part describes the use and options of the DataPilot in detail.
The first thing needed to work with the DataPilot is a list of raw data, similar to a database table, consisting of rows (data sets) and columns (data fields). The field names are in the first row above the list.
The data source could be an external file or database. For the simplest case, where data is contained in a Calc spreadsheet, Calc offers sorting functions that do not require the DataPilot.
For processing data in lists, the program needs to know where in the spreadsheet the table is. The table can be anywhere in the sheet, in any position. A spreadsheet can contains several unrelated tables.
Calc recognizes your lists automatically. It uses the following logic:
Starting from the cell you’ve selected (which must be within your list), Calc checks the surrounding cells in all 4 directions (left, right, above, below). The border is recognized if the program discovers an empty row or column, or if it hits the left or upper border of the spreadsheet.
This means that the described functions can only work correctly if there are no empty rows or columns in your list. Avoid empty lines (for example for formatting). You can format your list by using cell formats.
|
Rule |
No empty rows or empty columns are allowed within lists. |
If you select more than one single cell before you start sorting, filtering or calling the DataPilot, then the automatic list recognition is switched off. Calc assumes that the list matches exactly the cells you have selected.
|
Rule |
For sorting, filtering, or using the DataPilot, always select only one cell. |
A relatively common source of errors is to inadvertently declare a list by mistake and then sort the list. If you select multiple cells (for example, a whole column) then the sorting mixes up the data that should be together in one row.
In addition to these formal aspects, the logical structure of your table is very important when using the DataPilot.
|
Rule |
Calc lists must have the normal form; that is, they must have a simple linear structure. |
When entering the data, do not add outlines, groups, or summaries. This becomes clear when we think about what we could have done wrong in our Sales list example in the section “Examples with step by step descriptions” starting at page 5. Here are some mistakes commonly made by inexperienced spreadsheet users:
You made several sheets, for example, a sheet for each group of articles. Analyses are then possible only within each group. Analyses for several groups would be a lot of work.
In the Sales list, instead of only one column for the amount, you made a column for the amounts for each employee. The amounts then had to be entered into the appropriate column. An analysis with the DataPilot would not be possible any more. In contrast, one result of the DataPilot is that you can get results for each employee if you have entered everything in one column.
You entered the amounts in chronological order. At the end of each month you made a sum total. In this case, sorting the list for different criteria is not possible because the DataPilot will treat the sum totals the same as any other figure. Getting monthly results is one of the very fast and easy features of the DataPilot.
Start the DataPilot with Data → DataPilot → Start. If the list to be analyzed is in a spreadsheet table, select only one cell within this list. Calc recognizes and selects the list automatically for use with the DataPilot.
There are three possible data sources for the DataPilot: a Calc spreadsheet, an external data source that has to be registered in LibreOffice, or access to an OLAP system (not available at this time).
The simplest and most often used case is analyzing a list in a Calc spreadsheet. The list might be updated regularly or the data might be imported from a different application.
For example, a huge list can be copied from a different application and pasted into Calc. The behavior of Calc while inserting the data depends on the format of the data. If the data is in a common spreadsheet format, it is copied directly into Calc. However, if the data is in plain text, the Text Import dialog appears; see Figure 24 in this chapter and Chapter 1, Introducing Calc, for more more information.
Calc can import data from a huge number of foreign data formats, for example from other spreadsheets (Excel, Lotus 1, 2, 3), from databases (like dBase), and from simple text files including CSV formats.
The drawback of copying or importing foreign data is that it will not update automatically if there are changes in the source file. With a Calc file you were previously limited to 65,535 rows but this has been expanded to one million rows.
A registered data source in LibreOffice is a connection to data held in a database outside Calc. This means that the data to be analyzed will not be saved in Calc; Calc always uses the data from the original source. Calc is able to use many different data sources and also databases that are created and maintained with LibreOffice Base. See Chapter 10, Linking Calc Data, for more information.
No implementation exists at the moment so this option is not available.
The function of the DataPilot is managed in two places: first in the DataPilot dialog and second through manipulations of the result in the spreadsheet. This section describes the dialog in detail.
In the DataPilot (Figure 34) are four white areas that show the layout of the result. Beside these white areas are buttons with the names of the fields in your data source. To choose a layout, drag and drop the field buttons into the white areas.
The Data Fields area in the middle must contain at least one field. Advanced users can use more than one field here. For the data field an aggregate function is used. For example, if you move the sales field into the Data Fields area, it appears there as Sum – sales.
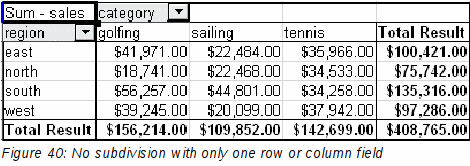
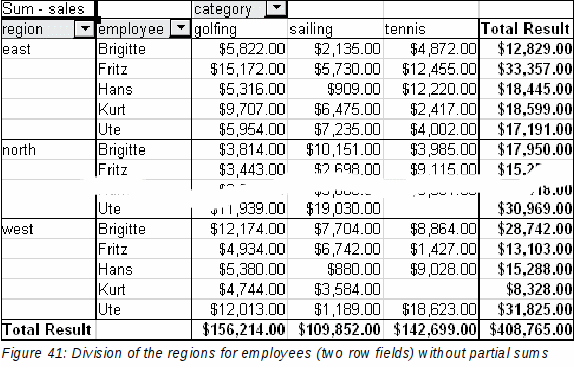
Row Fields and Column Fields indicate in which groups the result will be sorted in the rows and columns. If there are no entries in one of these area, then partial sums will not be provided for the corresponding rows or columns. Often more than one field is used at the same time get partial sums for rows or columns. The order of the fields gives the order of the sums from overall to specific.
For example, if you drag region and employee into the Row Fields area, the sum will be divided into the employees. Within the employees will be the listing for the different regions.
Fields that are placed into the Page Fields area appear in the result above as a drop down list. The summary in your result takes only that part of your base data into account that you have selected. For example, if you use employee as a page field, you can filter the result shown for each employee.
To remove a field from the white layout area just drag it to the border and drop it (the cursor will change to a crossed symbol), or click the Remove button.
To expand the DataPilot and show more options, click More.
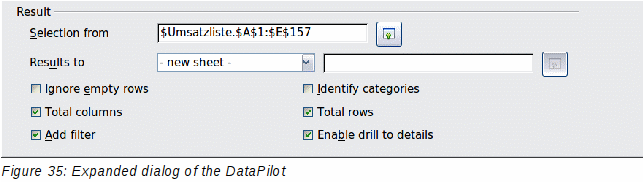
Selection from
Shows the range of cells used in the DataPilot.
Results to
Results to defines where your result will be shown. If you do not enter anything, the DataPilot will put your result below the list that contains your data. This could result in overwriting any data that is already in that location. To avoid overwriting data, you can leave Results to as – undefined – and enter a cell reference to tell the DataPilot where to show the results.1 However, a generally better approach is to use - new sheet – to add a new sheet to the spreadsheet file and place the results there.
Ignore empty rows
If the source data is not in the recommended form, this option tells the DataPilot to ignore empty rows.
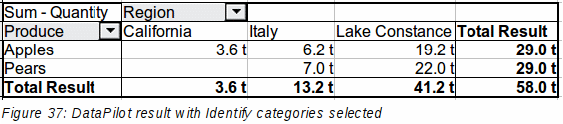
Identify categories
If the source data has missing entries in a list and does not meet the recommended data structure (see Figure 36), the DataPilot adds it to the listed category above it. If this option is not chosen, then the DataPilot inserts (empty) (see Figure 38).
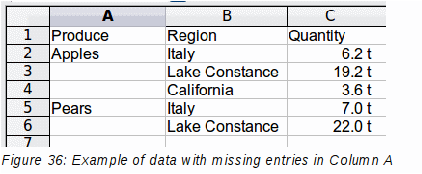
The option Identify categories ensures that in this case rows 3 and 4 are added to the product Apples and row 6 is added to Pears (see Figure 37).
Without category recognition, the DataPilot shows an (empty) category (Figure 38).
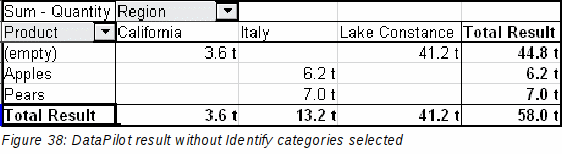
Logically, the behavior without category recognition is better. A list with the shown missing entries is also less useful, because you cannot use other functions such as sorting or filtering.
Total columns / total rows
With this option you decide if the DataPilot will show an extra row with the sums of each column or if it adds on the very right a column with the sums of each row. In some cases, an added total sum is meaningless, for example if your entries are accumulated or the result of comparisons.
Add filter
Use this option to add or hide the cell labelled Filter above the DataPilot results. This cell is a convenient button for additional filtering options within the DataPilot.
Enable drill to details
If you double-click on a single cell in the DataPilot result, this function gives a more detailed listing of an individual entry. If this function is disabled, the double-click will keep its usual edit function within a spreadsheet.
More settings for the fields – Field Options
The options discussed in the previous section are valid for the DataPilot in general. Additionally, you can change settings for every field that you have added to the DataPilot layout. Do this either by clicking on the Options button in the DataPilot dialog or by double-clicking on the appropriate field.
There are differences between data fields, row or column fields, and page fields of the DataPilot.
In the Options dialog of a data field you can select the Sum function for accumulating the values from your data source. In many cases you will need the sum function, but other functions (like standard distribution or a counting function) are also available. For example, the counting function can be useful for non-numerical data fields.
On the Data Field dialog, click More to see more options.
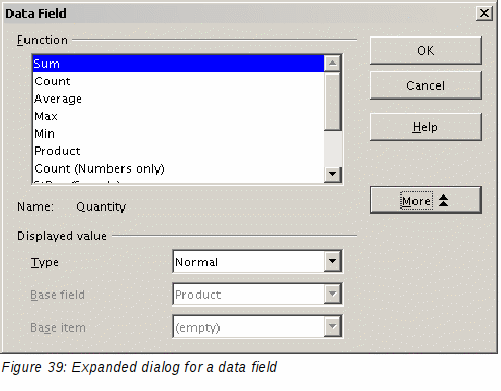
In the Displayed value section, you can choose other possibilities for analysis by using the aggregate function. Depending on the setting for Type, you may have to choose definitions for Base field and Base element. The table below lists the possible types of displayed value and associated base field and element, together with a note on usage.
|
Type |
Base field |
Base element |
Analysis |
|
Normal |
— |
— |
Simple use of the chosen aggregate function (for example, sum) |
|
Difference from |
Selection of a field from the data source of the DataPilot (for example, employee) |
Selection of an element from the selected base field (for example, Brigitte) |
Result as difference to the result of the base element (for example, Sales volume of the employees as difference of the sales volume of Brigitte) |
|
% of |
Selection of a field from the data source of the DataPilot (for example, employee) |
Selection of an element from the selected base field (for example, Brigitte) |
Result as a ratio based on the result of the base element (for example, Sales result of the employee relative to the sales result of Brigitte) |
|
% difference from |
Selection of a field from the data source of the DataPilot (for example, employee) |
Selection of an element from the selected base field (for example. Brigitte) |
Result as relative difference to the result of the base element (for example, Sales volume of the employees as relative difference of the sales volume of Brigitte) |
|
Running total in |
Selection of a field from the data source of the DataPilot (for example, date) |
— |
Result as a continuing sum (for example, Continuing sum of the sales volume for days or months) |
|
% of row |
— |
— |
Result as relative part of the result in the whole row (for example the row sum) |
|
% of column |
— |
— |
Result as relative part of the total column (for example, the column sum) |
|
% of total |
— |
— |
Result as relative part of the overall result (for example the total sum) |
|
Index |
— |
— |
Default result x total result / (row result x column result) |
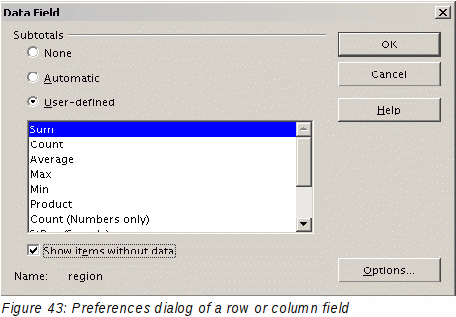
In the Options dialog for the row or column fields, you can choose to show partial sums for each category. Partial sums are deactivated by default. They are only useful if the values in one row or column field can be divided into partial sums for another (sub)field.
Some examples are shown in the next three figures.
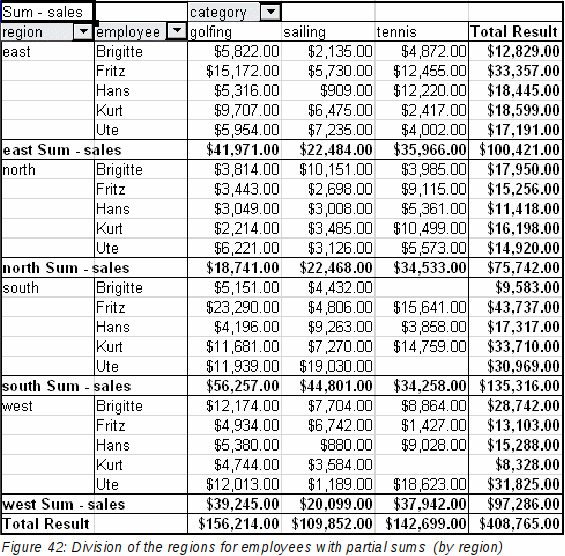
Choose the option Automatically to use the aggregate function for the partial results that can also be used for the data fields (see above). To set up the aggregate function for the partial results independently from the overall settings of the DataPilot, choose User-defined.
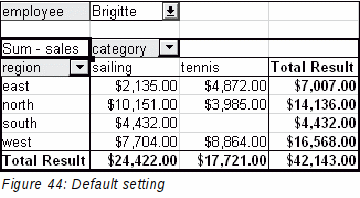
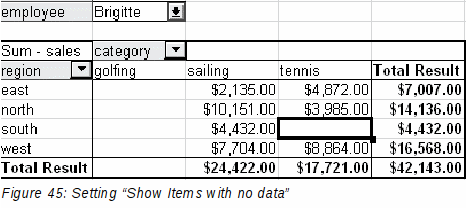
Normally, the DataPilot does not show a row or column for categories that have no entries in the underlying database. By choosing the Show items with no data option, you can force this.
For illustration purposes, the data was manipulated in such a way, that the employee Brigitte has no sales values for the category golfing.
The Options dialog for page fields is the same as for row and column fields, even though it appears to be useless to have the same settings as described for the row and column fields. With the flexibility of the DataPilot you can switch the different fields between pages, columns or rows. The fields keep the settings that you made for them. The page field has the same properties as a row or column field. These settings only take effect when you use the field not as page field but as row or column field.
Working with the results of the DataPilot
As mentioned above, the DataPilot is very flexible. An analysis can be totally restructured with only a few mouse clicks. Some functions of the DataPilot can be used only with the results of an analysis.
Right-click in the area of the resulting table of the DataPilot. The command Start opens the DataPilot dialog with all current settings.
Change layout by using drag and drop
The easiest and fastest method to change the layout of the DataPilot is drag and drop. Within the result table of the DataPilot, move one of the page, column, or row fields to a different position (see “Examples with step by step descriptions” starting on page 5).
You can remove a column, row, or page field from the DataPilot by clicking on and dragging it out of the DataPilot.
For many analyses or summaries, the categories have to be grouped. You can merge the results in classes or periods. In the DataPilot you do a grouping only after you have first made an ungrouped DataPilot table.
You can access the grouping with the menu entry Data → Group and Outline → Group or by pressing F12. It is important that you select the correct cell area. How the grouping function works is determined mainly by the type of values that have to be grouped. You need to distinguish between scalar values, date or time values, or other values, such as text, that you want grouped.
|
Note |
Before you can group, you have to produce a DataPilot with ungrouped data. The time needed for creating a DataPilot depends mostly on the number of columns and rows and not on the size of the basic data. Through grouping you can produce the DataPilot with a small number of rows and columns. The DataPilot can contain a lot of categories, depending on your data source. |
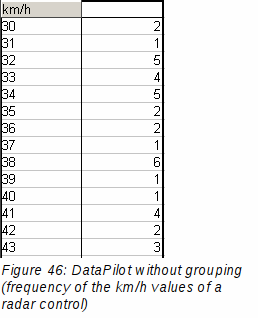
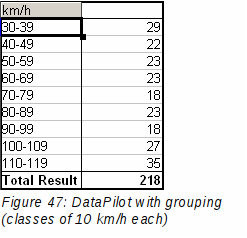
Grouping of categories with scalar values
For grouping scalar values, select a single cell in the row or column of the category to be grouped.
Choose Data → Group and Outline → Group from the menu bar or press F12; you get the following dialog.
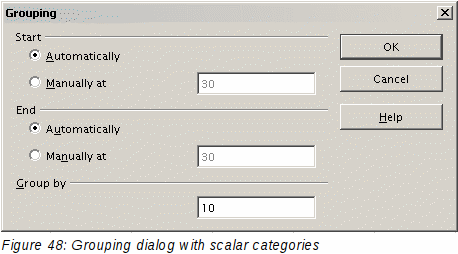
You can define in which value range (start/end) the grouping should take place. The default setting is the whole range from smallest to biggest value. In the field Grouping after you can enter the class size, this means the interval size (in this example groups of 10 km/h each).
Grouping of categories with date or time values
For grouping date or time values select a single cell in the column or row of the category to be grouped. This was demonstrated in all three examples in the section “Examples with step by step descriptions” starting on page 5.
With the menu entry Data → Group and Outline → Group or by pressing F12, you get the dialog shown in Figure 49.
You can decide the range of dates or times (start/finish) over which grouping should take place. The default setting is the entire period from the earliest to the latest value. In the field Group by you can enter the class size (the interval), that should be used for grouping.
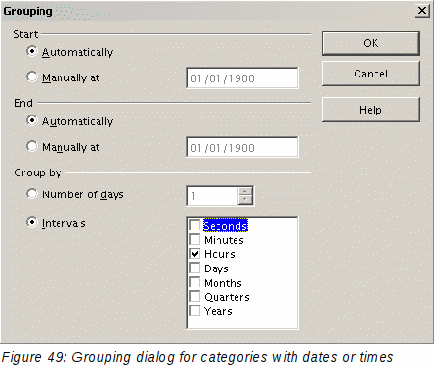
Possible intervals are: seconds, minutes, hours, days, months, quarters and years. These can be combined, for example grouping first by years and then within each year according to month.
Alternatively you can enter any number of days as grouping interval.
|
Tip |
For grouping the output of the DataPilot in calendar weeks, choose the beginning date on a Sunday or Monday and enter the grouping interval (Number of Days) as 7. |
Grouping without the automatic creation of intervals
If the categories contain text fields, then the automatic creation of intervals is not possible. You can define for each field (for example Department) which values you want to put together in one group.
Every time you use the menu entry Data → Group and Outline → Group or you press F12 and you have more than one cell selected, then all the cells will be selected as one group.
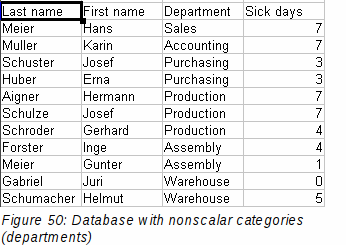
For grouping of non scalar categories, select in the result of the DataPilot all the individual field values that you want to put in the one group.
|
Tip |
You can select several non-contiguous cells in one step by pressing and holding the Control key while left-clicking with the mouse. |
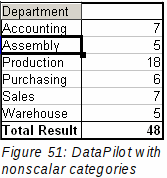
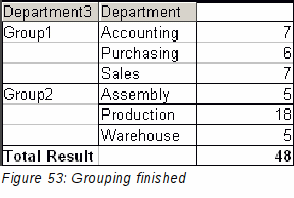
Given the input data shown in Figure 50, execute the Data Pilot with Department in the Row Field and Sum (Sick Days) in the Data Field. The output should look like that in Figure 51. Select with the mouse the Departments Accounting, Purchasing and Sales.
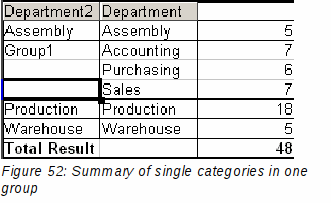
Choose the Data → Group and Outline → Group from the Menu bar or press F12. The output should now look like that in Figure 52. Repeat this for all groups that you want to create from the different categories (Select Assembly, Production and Warehouse and Group again. The output should look like Figure 53.
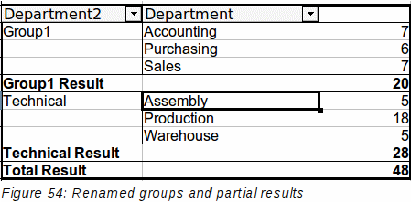
You can change the automatically given names for the groups and the newly created group field by editing the name in the input field (for example changing 'Group2' to 'Technical'). The DataPilot will remember these settings, even if you change the layout later on. For the following pictures, the dialog was called again (with a right-click, Start) and by selecting the icon “Department 2”, then Options, and finally from the preferences menu Automatic was selected. This generated the partial sum results shown in Figure 54. Double clicking Group 1 and Technical collapses the entries, as shown in Figure 55.

|
Note |
A well-structured database makes manual sorting within the DataPilot obsolete. In the example shown, you could add another column with the name Department, that has the correct entry for each person based on whether the employee’s department belongs to the group Office or Technical. The mapping for this (1:n relationship) can be done easily with the VLOOKUP function from Calc. |
The result of any DataPilot is sorted (categories) in columns and rows in an ascending order. You can change the sorting in three ways:
Select sort order from drop-down menus on each column heading.
Sort manually by using drag and drop.
Sort automatically by choosing the options in the preferences dialog of the row or column field.
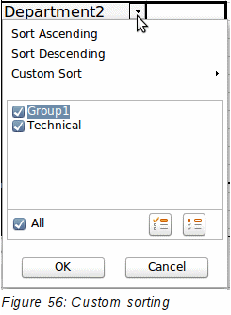
Select sort order from drop-down menus on each column heading
The simplest way to sort entries is to click the arrow on the right side of the heading and check the box(es) for the desired sort order. The custom sorting dialog is shown in Figure 56. Additional options exist to show all, show only the current item, or hide only the current item.
Sort manually by using drag and drop
You can change the order within the categories by moving the cells with the category values in the result table of the DataPilot.
Be aware that in Calc a cell must be selected. It is not enough that this cell contains the cell cursor. The background of a selected cell is marked with a different color. To achieve this, click in one cell with no extra key pressed and redo this by pressing also the Shift or Ctrl key. Another possibility is to keep the mouse button pressed on the cell you want to select, move the mouse to a neighbor cell and move back to your original cell before you release the mouse button.
To sort automatically, start the options of the preferences of the row or column field: right-click on the table area with the DataPilot result and choose Start to open the DataPilot (Figure 3). Within the Layout area of the DataPilot, double-click the field you want to sort. In the Data Field dialog (Figure 43), click Options to display the Data Field Options dialog (Figure 57).
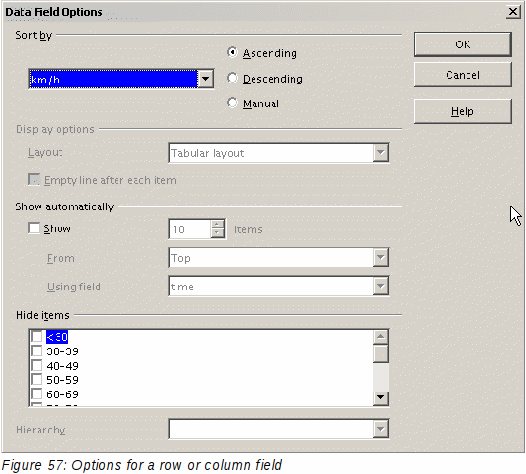
For Sort by choose either Ascending or Descending. On the left side is a drop-down list where you can choose the field this setting should apply to. With this method you can specify that sorting does not happen according to the categories but according to the results of the data field.
Drill allows you to show the related detailed data for a single, compressed value in the DataPilot result. To activate a drill, double-click on the cell or choose Data → Group and Outline → Show Details. You have to distinguish two cases:
The active cell is the category of a row or column field.
In this case drill means an additional breakdown into the categories of another field.
For example, double-click on the cell with the value golfing in the row field region. In this case the values that are aggregated in the category golfing are subdivided according to another field.
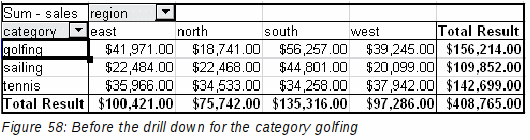
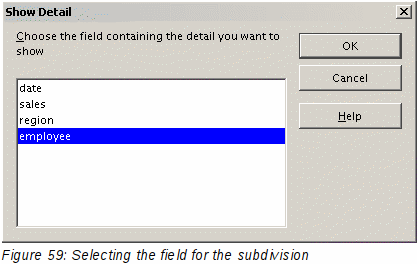
Since there are more possibilities for subdivision, a dialog appears so you can choose your setting.
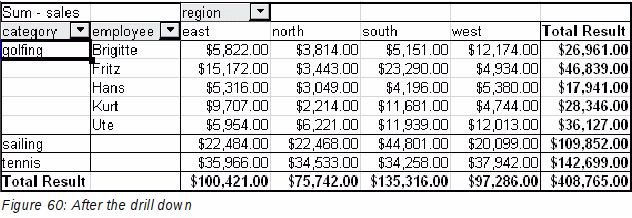
To hide the details again, double-click on the cell golfing or choose Data → Group and Outline → Hide Details.
The DataPilot remembers your selection (in our example the field employee), so that for the next drill down for a category in the field region the dialog does not appear. To remove the selection employee, open the DataPilot dialog by right-clicking and choosing Start, then delete the unwanted selection in the row or column field.
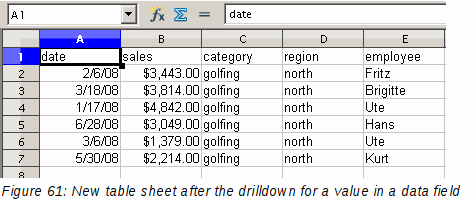
The active cell is a value of the data field.
In this case drill down means a listing of all data entries of the data source that aggregates to this value.
Double-click on the cell with the value $18,741 from Figure 58. You now have a new list of all data sets that are included in this value. This list is shown in a new sheet.
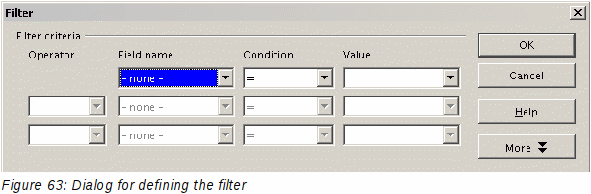
To limit the DataPilot analysis to a subset of the information that is contained in the data basis, you can filter with the DataPilot.
|
Note |
An Autofilter or default filter used on the sheet has no effect on the DataPilot analysis process. The DataPilot always uses the complete list that was selected when it was started. |
To do this, click Filter on the top left side above the results.
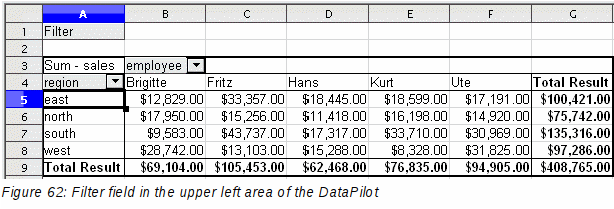
In the Filter dialog, you can define up to 3 filter options that are used in the same way as Calc’s default filter.
|
Note |
Even if they are not called a filter, page fields are a practical way to filter the results. The advantage is that the filtering criteria used are clearly visible. |
Updating (refreshing) changed values
After you have created the DataPilot, changes in the source data do not cause an automatic update in the resulting table. You have to always update (refresh) the DataPilot manually after changing any of the underlying data values.
Changes in the source data could appear in two ways:
The content of existing data sets has been changed.
For example, you might have changed a sales value afterward. To update the DataPilot, right-click in the result area and choose Refresh (or choose Data → DataPilot → Refresh from the menu bar).
You have added or deleted data sets in the original list.
In this case the change means that the DataPilot has to use a different area of the spreadsheet for its analysis. A change of the data reference for an existing DataPilot is not possible. You must redo the DataPilot from the beginning.
The cells in the results area of the DataPilot are automatically formatted in a simple format by Calc. You can change this formatting using all the tools in Calc, but note that if you make any change in the design of the DataPilot or any updates, the formatting will return to the format applied automatically by Calc.
For the number format in the data field, Calc uses the number format that is used in the corresponding cell in the source list. In most cases, this is useful (for example, if the values are in the currency format, then the corresponding cell in the result area is also formatted as currency). However, if the result is a fraction or a percentage, the DataPilot does not recognize that this might be a problem; such results must either be without a unit or be displayed as a percentage. Although you can correct the number format manually, the correction stays in effect only until the next update.
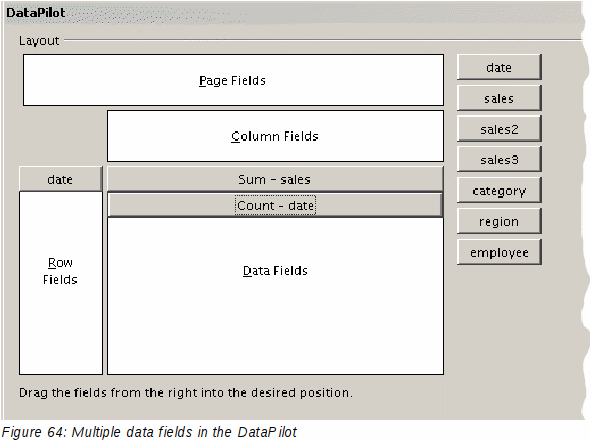
Until now we have assumed that the layout of the DataPilot contains only one data field. However, it is possible to have several data fields in the middle of the layout. This makes summaries and analyses of multiple aspects possible.
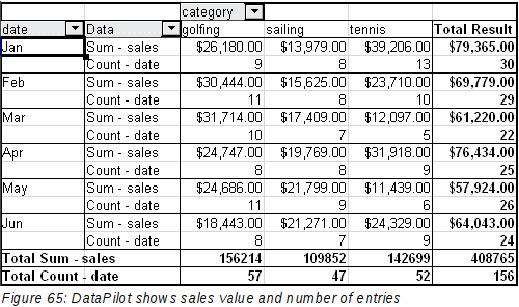
You could, for example, list all the sales values per day and additionally give the number of entries per day. To do this, put both the sales field and the date field into the Data Fields area. For the date field, choose the Count option for the aggregate function (see Figure 64).
Since every entry has a specific date, this field will give you the number of entries for each date. If you group the values per month, you get an overview with the sales value and the number of closed sales for each category and month (see Figure 65).
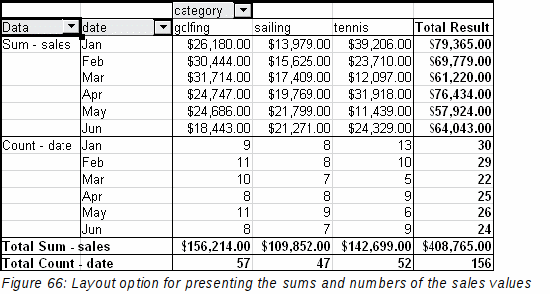
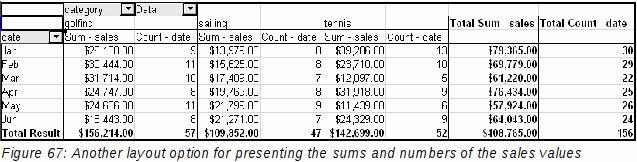
When using multiple data fields, the DataPilot result area contains a field called Data to allow for manipulating the existing data fields. You can move this field just like any other row or column field by using drag and drop. This is an easy way to achieve different structures for the results (Figures 66 and 67; drag and drop the Data field onto the date field label, or onto the category field label).
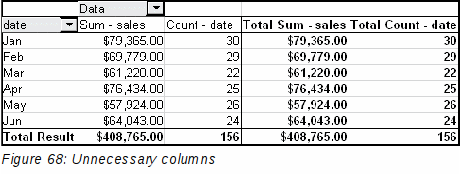
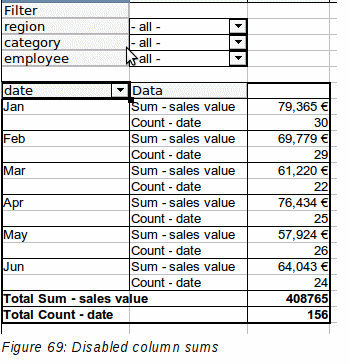
If you want to put the different data fields in different columns and your DataPilot does not contain another column field or you sort the different data fields in different rows and don’t have another row field, then it is useful to disable the view of the row or column sums. Just drag the category field label up to the Filter area.
A frequent use case for multiple data fields is the aggregation of one value according to different aggregate functions at the same time. You can create a DataPilot that shows you the monthly sales values and shows you additionally the smallest and the largest amounts.
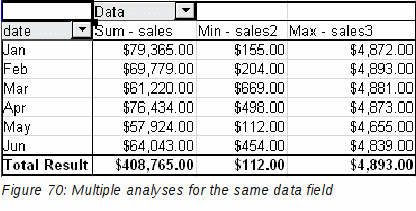
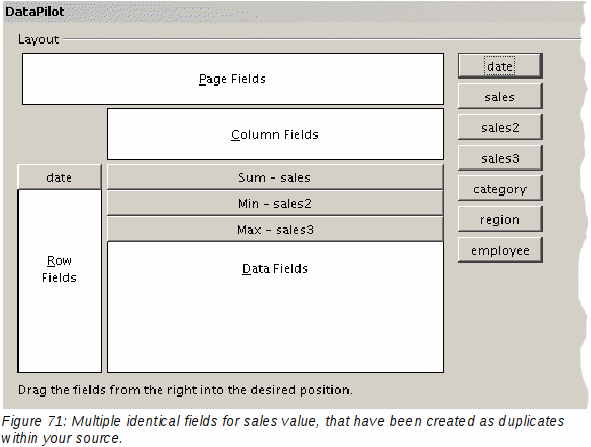
Unfortunately, Calc does not allow you to use the same data field multiple times. For such multiple analyses you have to duplicate the respective column in the source. This column is then available within the DataPilot; it just happens to have identical values (but the three columns are referenced in the example as sales, sales2 and sales3).
If you use the DataPilot very often, you might find the frequent use of the menu paths (Data → DataPilot → Start and Data → Group and Outline → Group) inconvenient.
For grouping, a shortcut is already defined: F12. For starting the DataPilot, you can define your own keyboard shortcut. If you prefer to have toolbar icons instead of keyboard shortcuts, you can create a user-defined symbol and add it to either your own custom made toolbar or the Standard toolbar.
For an explanation how to create keyboard shortcuts or add icons to toolbars, see Chapter 14, Setting Up and Customizing Calc.
The function GETPIVOTDATA can be used with formulas in Calc if you want to reuse the results from the DataPilot elsewhere in your spreadsheet.
Normally you create a reference to a value by entering the address of the cell that contains the value. For example, the formula =C6*2 creates a reference to cell C6 and returns the doubled value.
If this cell is located in the results area of the DataPilot, it contains the result that was calculated by referencing specific categories of the row and column fields. In Figure 72, the cell C6 contains the sum of the sales values of the employee Hans in the category Sailing. The formula in the cell C12 uses this value.
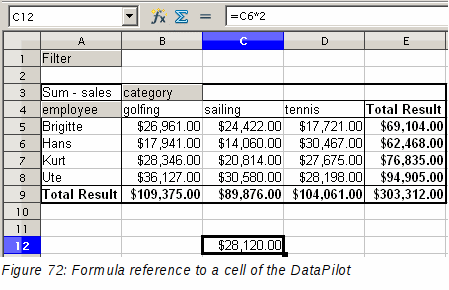
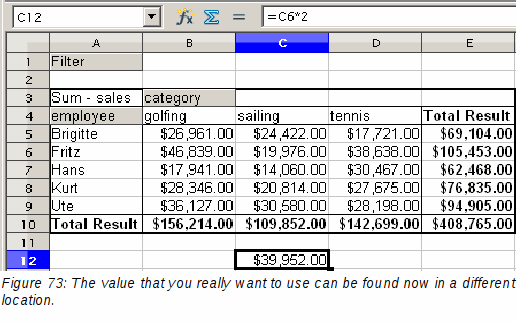
If the underlying data or the layout of the DataPilot changes, then you must take into account that the sales value for Hans might appear in a different cell. Your formula still references the cell C6 and therefore uses a wrong value. The correct value is in a different location. For example, in Figure 73, the location is now C7.
The function GETPIVOTDATA allows you to have a reference to a value inside the DataPilot by using the specific identifying categories for this value.
The syntax has two variations:
GETPIVOTDATA(target field, DataPilot; [ Field name / Element; ... ])
GETPIVOTDATA(DataPilot; specification)
The target field to specify which data field of the DataPilot is used within the function. If your DataPilot has only one data field, this entry is ignored, but you must enter it anyway.
If your DataPilot has more than one data field, then you have to enter the field name from the underlying data source (for example “sales value”) or the field name of the data field itself (for example “sum – sales value”).
The argument DataPilot specifies the DataPilot that you want to use. It is possible that your document contains more than one DataPilot. Enter here a cell reference that is inside the results area of your DataPilot. It might be a good idea to always use the upper left corner cell of your DataPilot, so you can be sure that the cell will always be within your DataPilot even if the layout changes.
Example: GETPIVOTDATA("sales value";A1)
If you enter only the first two arguments, then the function returns the total result of the DataPilot (“Sum – sales value” as the field will return a value of 408,765).
You can add more arguments as pairs with field name and element to retrieve specific partial sums. In the example in Figure 72, where we want to get the partial sum of Hans for sailing, the formula in cell C12 would look like this:
=GETPIVOTDATA("sales value";A1;"employee";"Hans";"category";"sailing")

The argument DataPilot has to be given in the same way as for the first syntax variation.
For the specifications, enter a list separated by spaces to specify the value you want from the DataPilot. This list must contain the name of the data field, if there is more than one data field, otherwise it is not required. To select a specific partial result, add more entries in the form of Field name[element].
In the example in Figure 72, where we want to get the partial sum of Hans for Sailing, the formula in cell C12 would look like this:
=GETPIVOTDATA(A1;"sales value employee[Hans] category[sailing]")

1In this case the word - undefined – is misleading because the output position is in fact defined.